Developing Renode
Renode has many built-in features to enable debugging of embedded software, e.g. debugging with GDB, but sometimes you might be interested in debugging Renode itself, especially if you are involved in its development
VS Code configurations
Visual Studio Code’s extensive plugin ecosystem provides a good developer experience for working with the Renode codebase. You may decide to use either the official VS Code app from Microsoft or use one of the OSS binary releases VSCodium or code-server. The main difference between the official and OSS releases is that they use different extensions gallery, so some extensions may be unavailable for each version.
When launching Renode in VS Code, you can use several ready-to-use configurations (as defined in the launch.json file):
Launch (console)- launches a previously built Renode under the .NET debugger.Attach- attaches the .NET debugger to a running Renode instance.(gdb) Tlib Attach- required to connect to a previously launched instance of Renode via GDB to debug translation libraries (implementation of emulated cores).
The workspace also provides build tasks (as defined in the tasks.json file):
Build - Debug- equivalent to running./build.sh -dfrom the console.Build - Release- equivalent to running./build.shfrom the console.
These configurations require the following VS Code extensions:
Debugging C# code
By following the steps below, you will be able to add regular breakpoints in Renode’s C# code.
Build Renode in debug configuration (or use the
Build - Debugtask in VS Code)../build.sh -dUse the
Launch (console)configuration.When Renode starts, you can set breakpoints and debug C# code as usual.
Debugging C code (translation libraries)
To debug the C implementation of emulated cores, follow the steps below.
Build Renode in debug configuration (or use the
Build - Debugtask in VS Code)../build.sh -dLaunch Renode with the debug flag enabled.
./renode -dWhen Renode starts, load the platform with a CPU whose code you wish to debug.
Use the
(gdb) Tlib Attachconfiguration to connect with GDB.Once started, a popup will appear. In the popup, type in
Renode.dll.From the drop-down list, select the option ending with
Renode.dll, as highlighted in the screenshot below.
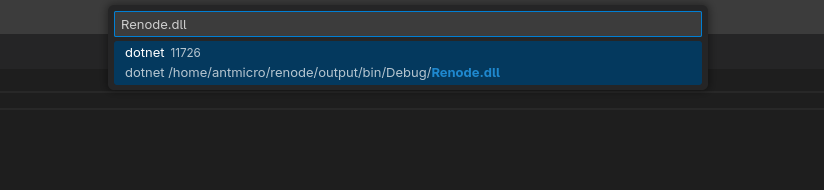
Figure 1 VSCode .NET drop-down list
Debugging with GDB
To start debugging Renode and its components using GDB, follow these steps:
Build Renode in debug configuration.
./build.sh -dLaunch Renode with the debug flag enabled.
./renode -dAttach GDB to a running Renode process to debug implementation of cores (in C via GDB).
Useful VS Code extensions
Below, you can find a list of VS Code extensions that may prove useful when working with Renode:
Description
C# support (code completion and debugging)
C support (code completion and debugging)
CMake support (for standalone Tlib building)
Python support
Robot Framework language server
Debugging embedded targets with Renode’s GDB server
Note
Some of these extensions may require additional configuration depending on your machine’s setup.
Tlib should be first built with CMake to generate the compile_commands.json file for clangd language services.