Metrics analyzer
Renode enables collecting execution data from the simulation and allows profiling the execution itself. Currently supported execution metrics:
executed instructions,
memory accesses,
peripheral accesses,
exceptions.
Profiling
To enable profiling in Renode, type:
(monitor) machine EnableProfiler "path_to_dump_file"
Run the simulation. The profiler is now collecting data from the metrics. Close Renode once this step is finished. As a result, you will get a dump file with collected metrics.
The dump can be analyzed using the metrics_parser Python library or visualised with the provided helper script.
Visualizing
To display graph representations of the collected data by means of the visualizer bundled with Renode follow these steps:
Additional prerequisites
To install prerequisites for the metrics visualization layer, run the following command from the root Renode directory :
python3 -m pip install --user -r tools/metrics_analyzer/metrics_visualizer/requirements.txt
Run script
Run the following script:
python3 tools/metrics_analyzer/metrics_visualizer/metrics-visualizer.py path_to_dump_file
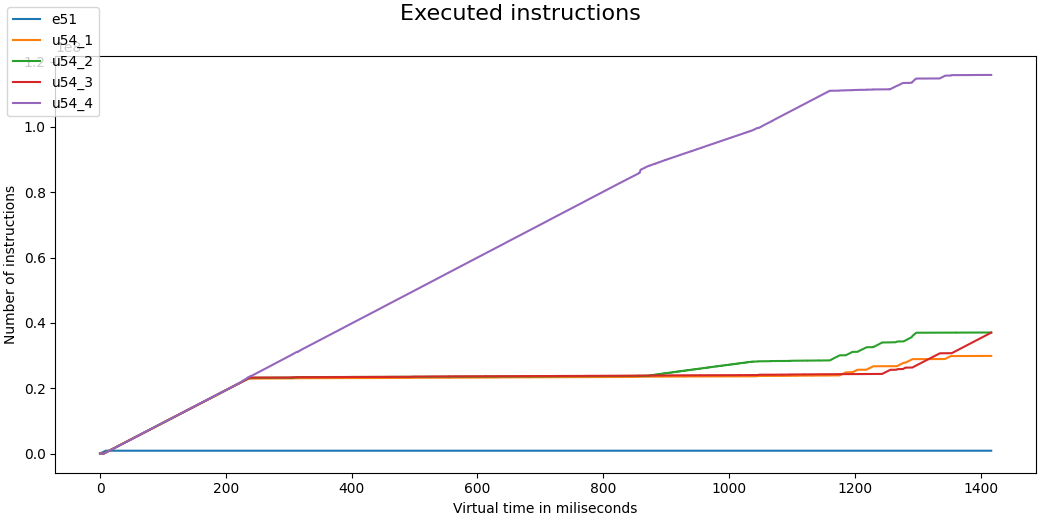
As a result, a window with graphs should appear, similar to the one presented below.